
This is whitebox. Probably the best hydrology related GIS program in the world. works for both windows, Linux and mac.
Hydrological modelling for dummies
Creating watersheds and streams from digital elevation models (DEM) are simple yet power full tools. Below is a short description on how it’s done in Whitebox gat.
The required data is:
- A digital elevation model (DEM).
- A shapefile with roads from the property map (named vl.shp)
- A shapefile with streams from the property map (named hl.shp)
These layers can be downloaded from https://atlas.slu.se/get/ (by Swedish students and researchers)
In order to get the digital elevation model into Whitebox you need to use Arcmap, Qgis, Saga, fme, r just gdal in order to transform the data into a format that Whitebox can read.
In Arcmap you use the tool called “raster to float” and add the resulting float file into Whitebox.
In Qgis you use “translate (convert format)” and chose getiff as output format.
Creating stream network
One you have all data in Whitebox it should look something like this

The first step of the actual modelling is to pre-process the DEM. This is done to low water to flow from each grid cell in the landscape to the outlet of the DEM. This is done in the first two steps when using high resolution DEMs.
1: Burn streams at roads

This tool will carve a path across roads at stream – road intersections. This is where you use the stream and road layers from the property map.
2. Breach depressions (fast)

This tool gives the option to calculate both flow directions (flow pointer) and flow accumulation using the standard D8 algorithm. The max breach length should be left blank. (expert users should use complete breaching in go spatial: GO-spatial)
3. Extract streams
A stream network is extracted from the flow accumulation grid. A flow accumulation grid is a summary of the area which flow to each cell in the landscape. When enough area “flow” to the same cell it will be wet. For this demo I will use 10ha or 25000 grid cells which is the early average in Krycklan. The flow accumulation grid was created in step 2.
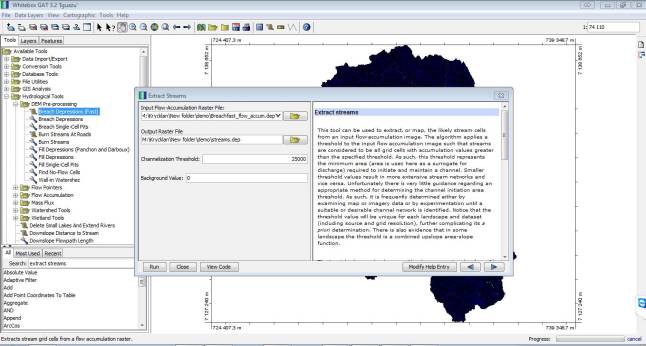
The resulting output is a raster where streams have the value of 1 and all other cells are 0. If you type “nodata” instead of 0 you will have a raster where streams are 1 and the rest nothing.

4. Convert raster streams to features
Vector streams are much better to use when making maps and a common practice is to convert the raster streams from previous step into vector streams. For this step you need the raster stream from step 3 and flow pointer from step 2.

The output looks like this:

Creating watersheds
A watershed is the area that flow into a specified point of the landscape. All water within a watershed will end up at the outlet.
5. Create a new shapefile with an outlet point.
Use the tool “create new shapefile and chose point type.

Once the layer is created you can click on the top bar where there is a polygon looking thing. Chose a FID (just a id for each point). Then click on the map where you want the outlet to be. Click on the line-looking icon to the left when you are happy with your points.

6. Snapp pour point
Once the points have been created they need to be moved to the correct location (unless you are sure they are already). For this step we use a tool named “snapp pour point”. for this you need to use the flow accumulation grid from step 2 and the point you created in step 5.

This tool will move the point to the cell with the highest flow accumulation within a specified distance.
7. Create watershed
When you run the watershed tool you need to choose the snapped point from step 6 and the flow pointer created in step 2.
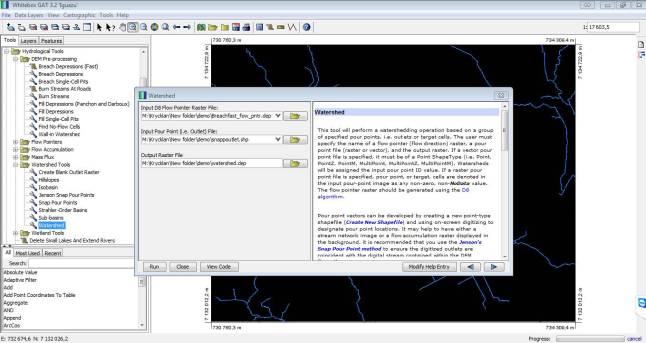
The output should look something like this:

All water (or any contaminant) within this area will flow to the outlet point. This is possibly the most important tool in “hydrobiogeochemical science”
Making a map
A few tips to make a map is to create a hillside from the original DEM and add the other layers on top. In the cartographic menu you can find north arrows, scale bars and legends but I recommend that you make the maps in Arcmap or qgis instead. Change size of the stream lines and outlet points. It’s also possible to convert the watershed to a shapefile. Just look under the conversion tools.

